Today (or tomorrow for H period) students completed the tree ID using the dichotomous key and created their own dichotomous key for a group of arthropods.
These two activities wrapped up Topic 5. Moving forward, students were given a new 'student syllabus' for Option G. Students were also given a guided notes packet, that will help to organize their notes.
We started Option G by outline the factors that influence the distribution of plant and animal species.
Your homework is to study for your test on Topic 5 on Thursday.
Showing posts with label Topic 5. Show all posts
Showing posts with label Topic 5. Show all posts
Monday, October 3, 2011

Friday, September 30, 2011
Topic 5.5 - Working with Dichotomous Keys
Today we reviewed bionomial nomenclature, the seven levels of taxa and how to distinguish between the four main phyla of plants.
Since the link on the blog for your assignment yesterday was broken, we discussed how to distinguish between the following phyla of animals: porifera, cnidaria, platyhelminthes, annelida, mollusca and arthropoda.
We spent the bulk of the class period learning about dichotomous keys, starting with making a key for the students in the class. Next students practiced identifying various leaves using a dichotomous key. This will be a skill that we use on academic travel to identify the organisms in the pitfall traps and that we collect from kick netting.


On Monday/Tuesday we will wrap up the tree identification activity and you will create your own dichotomous key for eight organisms.
Lastly, here's a final reminder about the DBQ on page 201 that is due Monday October 3rd for E period (or October 4th for H period).
Since the link on the blog for your assignment yesterday was broken, we discussed how to distinguish between the following phyla of animals: porifera, cnidaria, platyhelminthes, annelida, mollusca and arthropoda.
We spent the bulk of the class period learning about dichotomous keys, starting with making a key for the students in the class. Next students practiced identifying various leaves using a dichotomous key. This will be a skill that we use on academic travel to identify the organisms in the pitfall traps and that we collect from kick netting.

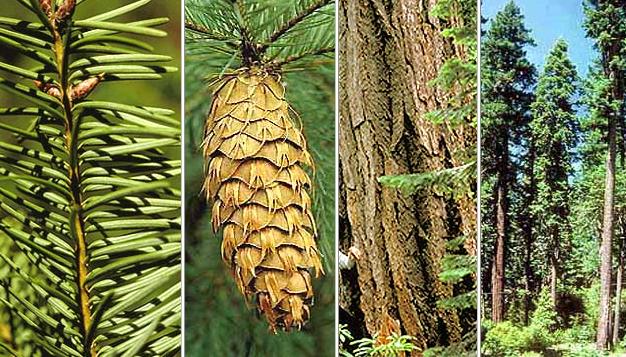

On Monday/Tuesday we will wrap up the tree identification activity and you will create your own dichotomous key for eight organisms.
Lastly, here's a final reminder about the DBQ on page 201 that is due Monday October 3rd for E period (or October 4th for H period).
Wednesday, September 28, 2011
Work for class on Thursday Sept. 29th
Here is what you need to do in class on Thursday.
You will be completing the two following assessment statements:
5.5.3 Distinguish between the following phyla of plants, using simple external recognition features: bryophyta, filicinophyta, coniferophyta and angiospermophyta.
5.5.4 Distinguish between the following phyla of animals, using simple external recognition features: porifera, cnidaria, platyhelminthes, annelida, mollusca and arthropoda.
Kingdom Plantae can be broken down into to main groups, non-vascular plants and vascular plants. You might be thinking, "ugh, plants." Well, plants are great and without them we'd be hard pressed to get all the oxygen we need (Thank you photosynthesis). You also need to learn about plants because you will be identifying plants on Academic Travel.

Click here to get to Mr. T's PowerPoint on topic 5.5. Start on Slide 14 (use the buttons at the bottom of the viewer to navigate). By clicking on each picture you can link to information about each type of plant.
Slide 15: Make this table in your notebook.
Slide 15: Fill in this table. If you're not sure what is meant by sporangia, look it up! Don't simply write things down if you don't understand them. You can also click back to slide 14 click on the image of the plant type to get more information.
Click the picture below. This will link you to a website where you can click on each phylum that you need to collect information about. Not sure which phylums you need to know about? Look at your syllabus! (or just scroll to the top of the post).
 You only need to write the brief description about the phylum, not the information about the classes.
Since this website doesn't have information about platyhelminthes nor arthropoda, you can find information about these two phylum, by looking at the links below.
Platyhelminthes
Arthropoda
If you finish this assignment, you can make flash cards or a review sheet for the test a week from Thursday.
You will be completing the two following assessment statements:
5.5.3 Distinguish between the following phyla of plants, using simple external recognition features: bryophyta, filicinophyta, coniferophyta and angiospermophyta.
5.5.4 Distinguish between the following phyla of animals, using simple external recognition features: porifera, cnidaria, platyhelminthes, annelida, mollusca and arthropoda.
So, let's begin!
Kingdom Plantae can be broken down into to main groups, non-vascular plants and vascular plants. You might be thinking, "ugh, plants." Well, plants are great and without them we'd be hard pressed to get all the oxygen we need (Thank you photosynthesis). You also need to learn about plants because you will be identifying plants on Academic Travel.

(Image from Mr. T's Topic 5.5 PowerPoint)
Click here to get to Mr. T's PowerPoint on topic 5.5. Start on Slide 14 (use the buttons at the bottom of the viewer to navigate). By clicking on each picture you can link to information about each type of plant.
Slide 15: Make this table in your notebook.
Slide 15: Fill in this table. If you're not sure what is meant by sporangia, look it up! Don't simply write things down if you don't understand them. You can also click back to slide 14 click on the image of the plant type to get more information.
And now, onto 5.5.4....
Click the picture below. This will link you to a website where you can click on each phylum that you need to collect information about. Not sure which phylums you need to know about? Look at your syllabus! (or just scroll to the top of the post).
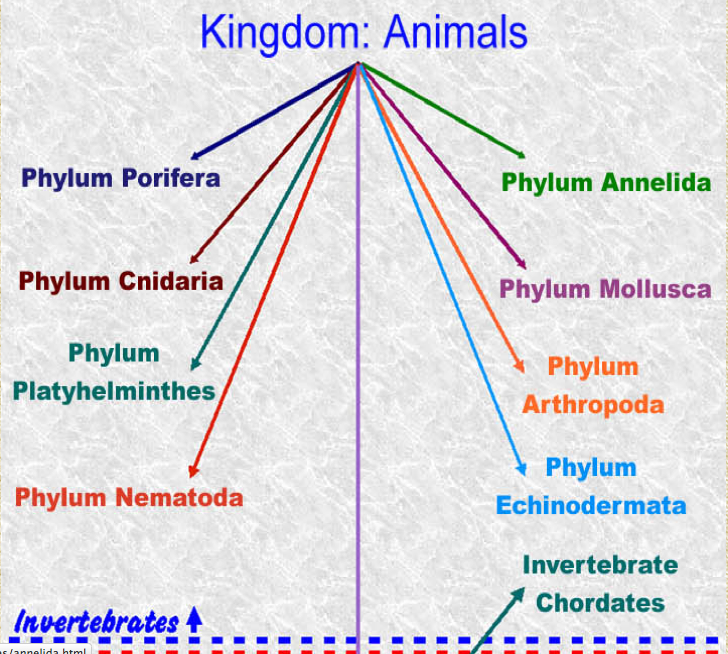
Since this website doesn't have information about platyhelminthes nor arthropoda, you can find information about these two phylum, by looking at the links below.
Platyhelminthes
Arthropoda
If you finish this assignment, you can make flash cards or a review sheet for the test a week from Thursday.
Monday, September 26, 2011
Topic 5.4 - Evolution
Per Angelika's request, here is the evolution PowerPoint we have been working from. I did not create this wonderful presentation. It comes from Stephen Taylor.
Evolution (Core)
View more presentations from Stephen Taylor
Click the picture below to link to the video clip we watched about antibiotic resistance in TB. (5.4.8)

Your job is to find information on another example of evolution in response to environmental change. You should be prepared to share with the class a brief summary that includes: what organism was affected, what caused the change, and what the change was.
Below are some ideas to get you started:
* The changes in size and shape of the beaks of Galapagos finches;
*Pesticide resistance in crops
* Industrial melanism or heavy- metal tolerance in plants.
Click the picture below to link to the video clip we watched about antibiotic resistance in TB. (5.4.8)
Homework: Due Wednesday:
On the syllabus for 5.4.8, it says "Explain two examples of evolution in response to environmental change; one must be antibiotic resistance in bacteria. "Your job is to find information on another example of evolution in response to environmental change. You should be prepared to share with the class a brief summary that includes: what organism was affected, what caused the change, and what the change was.
Below are some ideas to get you started:
* The changes in size and shape of the beaks of Galapagos finches;
*Pesticide resistance in crops
* Industrial melanism or heavy- metal tolerance in plants.
Friday, September 23, 2011
Topic 5.4 - Evolution
Today students took a reading quiz on pages 193-196. This quiz will count towards the effort grade.
After discussing the quiz, we scrolled through the John Kyrk evolution animation. Click the picture below to link to this incredible animation.

We also watched part of an interview with David Attenborough on his thoughts on Charles Darwin.
Homework for Monday (E period) or Tuesday (H period): Complete the DBQ on page 194. Be sure to carefully read the prompt and command terms in the questions.
After discussing the quiz, we scrolled through the John Kyrk evolution animation. Click the picture below to link to this incredible animation.

We also watched part of an interview with David Attenborough on his thoughts on Charles Darwin.
Homework for Monday (E period) or Tuesday (H period): Complete the DBQ on page 194. Be sure to carefully read the prompt and command terms in the questions.
Topic 5.4 - Evolution
Yesterday students worked the questions they wrote using the command terms, afterwhich we started Topic 5.4 Evolution.
Below are some short videos to help you get started on this topic.
Who Was Charles Darwin
Isn't Evolution Just a Theory?
The homework was to read and take notes on pages 193-196
Below are some short videos to help you get started on this topic.
Who Was Charles Darwin
Isn't Evolution Just a Theory?
The homework was to read and take notes on pages 193-196
Wednesday, September 21, 2011
Recaping Topic 5.3
Today we recapped topic topic 5.3.
Using a logistical growth simulation, we compared what happens when you change the rate of reproduction (r) for how long it takes to reach carrying capacity (K). Click the picture below to link to the simulation.
We also looked at Breathing Earth as a simulation that connects topics 5.2 and 5.3 (click on the picture below to link to it).

Homework: page 184 # 3, #4, #6
Using a logistical growth simulation, we compared what happens when you change the rate of reproduction (r) for how long it takes to reach carrying capacity (K). Click the picture below to link to the simulation.
We also looked at Breathing Earth as a simulation that connects topics 5.2 and 5.3 (click on the picture below to link to it).
Homework: page 184 # 3, #4, #6
Tuesday, September 20, 2011
DBQ: Uncertainty in temperature rise projections
Here are the answers to the DBQ: Uncertainty in temperature rise projections (p. 190)
1. AIFI
2. Minimum 1.1 deg. C, maximum 5.9 deg. C
3. 1.8 deg. C
4. 2.1 deg C in the Arctic versus 1.8 deg C for the global average. The Arctic temperature rise is higher than the global average.
5. In addition to greenhouse gasses, it is possible that positive feedback cycles will exacerbate the problem; such as melting of polar ice caps; the permafrost melting or increase in cloud cover.
6. You should have made reference to the following things: Depends on whether data used by centers is the same or independently gathered; more centers means more validity in the data; the importance of a larger sample size.
7. Your answer should have made reference to the following points:
* According to the precautionary principle strong action is called for because the consequences of inaction are potentially catastrophic.
* The costs of mitigating the problem should be borne equally among all countries.
* Developing nations need access to carbon production to achieve a higher standard of living.
* Actions taken will require greater reductions of carbon consumption in the developed world.
8. Your answer should have made reference to the following points:
* Forces acting in support of avoiding economic risks are generally more powerful than protecting the environment.
* Some shifts in economic activity are possible.
* Examining the effects of shifts in local vs. global economies.
* A shift to a greater degree of subsistence activities.
* Fossil fuel shortage may aid shift.
1. AIFI
2. Minimum 1.1 deg. C, maximum 5.9 deg. C
3. 1.8 deg. C
4. 2.1 deg C in the Arctic versus 1.8 deg C for the global average. The Arctic temperature rise is higher than the global average.
5. In addition to greenhouse gasses, it is possible that positive feedback cycles will exacerbate the problem; such as melting of polar ice caps; the permafrost melting or increase in cloud cover.
6. You should have made reference to the following things: Depends on whether data used by centers is the same or independently gathered; more centers means more validity in the data; the importance of a larger sample size.
7. Your answer should have made reference to the following points:
* According to the precautionary principle strong action is called for because the consequences of inaction are potentially catastrophic.
* The costs of mitigating the problem should be borne equally among all countries.
* Developing nations need access to carbon production to achieve a higher standard of living.
* Actions taken will require greater reductions of carbon consumption in the developed world.
8. Your answer should have made reference to the following points:
* Forces acting in support of avoiding economic risks are generally more powerful than protecting the environment.
* Some shifts in economic activity are possible.
* Examining the effects of shifts in local vs. global economies.
* A shift to a greater degree of subsistence activities.
* Fossil fuel shortage may aid shift.
Monday, September 19, 2011
Zebra Mussels Webquest
Today (or tomorrow for H period) we started class with a brief recap of the homework. For the remaining class time, students worked on a Webquest that addresses the following assessment statements:
You can link to the Webquest here and read background about the Zebra Mussel here.

Homework: There's no homework due tomorrow. However if you have time, you can always review your notes or make a few flash cards or a quizlet.
5.3.2 Draw and label a graph
showing a sigmoid (S-shaped) population growth curve.
G.3.4 List three examples of the introduction of alien
species that have had significant impacts on ecosystems.
G.3.6 Outline one example of biological control of
invasive species.
You can link to the Webquest here and read background about the Zebra Mussel here.

Homework: There's no homework due tomorrow. However if you have time, you can always review your notes or make a few flash cards or a quizlet.
Friday, September 16, 2011
News Flash: Arctic Ice Hits Near-Record Low, Threatening Wildlife
This article
"Arctic Ice Hits Near-Record Low, Threatening Wildlife"
was front page news at NPR.org today. The article title is basically what assessment statement 5.2.6 is asking you to understand.
(Don't forget about your homework for Monday, which is right below this post)
Finishing Topic 5.2
Today we wrapped up topic 5.2 - The Greenhouse Effect, by examining the consequences of a global temperature rise on arctic ecosystems (5.2.6).
Upon finishing topic 5.2, students gave themselves revisit scores on their student syllabus.
Students spent the remaining class time working on the DBQ: Uncertainty in temperature rise projections. The answer for this question will be posted at the end of the day on Tuesday (when both classes have turned in their answers).
Homework for Monday or Tuesday of next week (depending on when your class meets):
Define the following words: natality, immigration, mortality, emigration and read/take notes on page 182. If you have not already done so, you should also finish the DBQ assigned in class today.
 Optional reading :
Please bring a computer to class on Wednesday. The computer needs to have Flash installed, but it does not need Excel.
Upon finishing topic 5.2, students gave themselves revisit scores on their student syllabus.
Students spent the remaining class time working on the DBQ: Uncertainty in temperature rise projections. The answer for this question will be posted at the end of the day on Tuesday (when both classes have turned in their answers).
Homework for Monday or Tuesday of next week (depending on when your class meets):
Define the following words: natality, immigration, mortality, emigration and read/take notes on page 182. If you have not already done so, you should also finish the DBQ assigned in class today.
 Optional reading :
Melting Tundra Creating Vast River of Waste Into Arctic Ocean
Please bring a computer to class on Wednesday. The computer needs to have Flash installed, but it does not need Excel.
Thursday, September 15, 2011
Analyzing Data on CO2
Today we will be using data from theMauna Loa Observatory on the Big Island of Hawaii to look at trends in CO2 levels.
Follow the directions below to complete the assignment:
Part 1:
1. Open a word document and title it "Analyzing CO2 Data"
2. Click here to access the Seattle Central Website, open this site in a new window or tab. Information about the data: Time is expressed in months, with May of 1974 as month 1 (zero was not used to avoid the usual problems with exponential and power law regression). The observatory is at 3,400 m or 11,000 feet above sea level.
3. Download the data in an Excel File.
4. Open the Excel File.
5. Create an x y scatter plot for the data. Not sure how to make an x y scatter plot? If you are a Mac user, click here. If you use a PC, you can still look at the slideshow, but some of the formatting in your program will be different.
6. Make sure to add a title and label each axis appropriately. Copy and paste this graph into your word document titled "Analyzing CO2 Data."
Part 2:
Answer the following discussion questions below the graph in your word document. Please answer using complete sentences.
Part 3:
Find a current (within the last year) new article on the increase in CO2 levels.
Write the url and title for the article.
Provide a brief summary of the article.
Based on the news source, how much trust can you put into what is said? Explain your answer.
This assignment is due by the start of class on Friday. You may either print out your answers and bring them to class or email me your answers.
Follow the directions below to complete the assignment:
Part 1:
1. Open a word document and title it "Analyzing CO2 Data"
2. Click here to access the Seattle Central Website, open this site in a new window or tab. Information about the data: Time is expressed in months, with May of 1974 as month 1 (zero was not used to avoid the usual problems with exponential and power law regression). The observatory is at 3,400 m or 11,000 feet above sea level.
3. Download the data in an Excel File.
4. Open the Excel File.
5. Create an x y scatter plot for the data. Not sure how to make an x y scatter plot? If you are a Mac user, click here. If you use a PC, you can still look at the slideshow, but some of the formatting in your program will be different.
6. Make sure to add a title and label each axis appropriately. Copy and paste this graph into your word document titled "Analyzing CO2 Data."
Part 2:
Answer the following discussion questions below the graph in your word document. Please answer using complete sentences.
A. You no longer need to do question A.
B.Suggest why average carbon dioxide levels increased each year represented in the graph?
C. Explain why the concentrations of CO2 show a yearly zig-zag pattern.
D. Suggest why the island of Hawaiʻi one of the more ideal locations for collecting atmospheric CO2 as a model of the concentration for the world?
E. Does the data collected at Mauna Loa tie in to scientists' recent predictions about climate change and global warming?
Part 3:
Find a current (within the last year) new article on the increase in CO2 levels.
Write the url and title for the article.
Provide a brief summary of the article.
Based on the news source, how much trust can you put into what is said? Explain your answer.
This assignment is due by the start of class on Friday. You may either print out your answers and bring them to class or email me your answers.
Wednesday, September 14, 2011
Your first quiz & revisting the precautionary principle
Today students had their first quiz, for many it was very successful. After reviewing the quiz, we took some time to go over the grading for the class and revisited the precautionary principle.
Please read page 188 tonight and make sure to bring your computer to class tomorrow.
Please read page 188 tonight and make sure to bring your computer to class tomorrow.
Tuesday, September 13, 2011
Quiz Tomorrow
Tomorrow you have your first IB quiz. You are responsible for topic 5.1. The quiz has seven multiple choice questions and you will have nine minutes (the time limit is set by the IB) to complete the quiz.
We'll correct the quiz in class, so you can have instant feedback. The remaining 25 minutes in class will be used to revisit the precautionary principle writing prompt and work on a DBQ.
Please remember to bring a computer (and a charger for your computer) to class on Thursday.
We'll correct the quiz in class, so you can have instant feedback. The remaining 25 minutes in class will be used to revisit the precautionary principle writing prompt and work on a DBQ.
Please remember to bring a computer (and a charger for your computer) to class on Thursday.
DBQ: Fishing Down Marine Food Webs
DBQ: Fishing down marine food webs
Here are the answers for the DBQ on page 180:
1. A possible way to deduce the trophic level of a fish once it is captured is to examine its stomach contents. By determining the trophic levels of the fish's prey, one could potentially determine the tropic level of the captured fish.
2. a) Both marine and freshwater fisheries have been declining over the study period. The rate of decline is faster in fresh water populations than in marine populations. The rate of decline is more constant in marine/accelerating in freshwater.
b) Freshwater fisheries have been overfished for longer; freshwater populations smaller/more susceptible to disruption.
3. Generally, increasing in age means increasing size. Therefore increasing size means broader range of prey including larger fish/higher trophic level fish. (note for students: just because an animal is bigger doesn't necessarily mean that its tropic level is higher. For example the Northern Right Whale has a trophic level of 3.2, while the Pantropical Spotted Dolphin has a trophic level of 4.3). I didn't make those numbers up, they came from the paper "Diet composition and trophic levels of marine mammals" by D. Pauly, A.W. Trites, E. Capuli and V. Christensen (ICES Journal of Marine Science, 55, 467-481)
4. Age is correlated with trophic level; lowering of the tropic level means lowering the mean age.
5. Greater biomass of lower tropic level means a higher sustainable yield which allows higher trophic levels to recover. In addition, less energy is lost when there are fewer tropic levels. As the trophic levels increase, less of the initial energy is available.
Here are the answers for the DBQ on page 180:
1. A possible way to deduce the trophic level of a fish once it is captured is to examine its stomach contents. By determining the trophic levels of the fish's prey, one could potentially determine the tropic level of the captured fish.
2. a) Both marine and freshwater fisheries have been declining over the study period. The rate of decline is faster in fresh water populations than in marine populations. The rate of decline is more constant in marine/accelerating in freshwater.
b) Freshwater fisheries have been overfished for longer; freshwater populations smaller/more susceptible to disruption.
3. Generally, increasing in age means increasing size. Therefore increasing size means broader range of prey including larger fish/higher trophic level fish. (note for students: just because an animal is bigger doesn't necessarily mean that its tropic level is higher. For example the Northern Right Whale has a trophic level of 3.2, while the Pantropical Spotted Dolphin has a trophic level of 4.3). I didn't make those numbers up, they came from the paper "Diet composition and trophic levels of marine mammals" by D. Pauly, A.W. Trites, E. Capuli and V. Christensen (ICES Journal of Marine Science, 55, 467-481)

4. Age is correlated with trophic level; lowering of the tropic level means lowering the mean age.
5. Greater biomass of lower tropic level means a higher sustainable yield which allows higher trophic levels to recover. In addition, less energy is lost when there are fewer tropic levels. As the trophic levels increase, less of the initial energy is available.
Monday, September 12, 2011
The Carbon Cycle & ToK Connections
Today we reviewed the carbon cycle (click the picture to link to the animation and background information. We also saw not one, but two ToK links in the biology syllabus. The first one we saw was the Gaia Hypothesis. Here's a connection between the Gaia Hypothesis and carbon dioxide
"(C02) in the Earth's atmosphere is far less abundant than chemistry alone would allow. If life was deleted carbon dioxide would become 30 times more abundant. Large quantities of carbon dioxide are currently locked up by living organisms." (taken from the aforementioned Gaia Hypothesis link)
We finished the class with students completing a timed writing prompt on Topic 5.2.5
Your homework is to study for your quiz on Topic 5.1 in class on Wednesday. Anything in the syllabus for topic 5.1 is fair game.
We also saw not one, but two ToK links in the biology syllabus. The first one we saw was the Gaia Hypothesis. Here's a connection between the Gaia Hypothesis and carbon dioxide"(C02) in the Earth's atmosphere is far less abundant than chemistry alone would allow. If life was deleted carbon dioxide would become 30 times more abundant. Large quantities of carbon dioxide are currently locked up by living organisms." (taken from the aforementioned Gaia Hypothesis link)
We finished the class with students completing a timed writing prompt on Topic 5.2.5
Your homework is to study for your quiz on Topic 5.1 in class on Wednesday. Anything in the syllabus for topic 5.1 is fair game.
Friday, September 9, 2011
Wrapping up Topic 5.1
Today we finished Topic 5.1. We started class by attempting to redraw the food webs that you created for homework. This is information you need to remember in two years, were you able to remember it less than 24 hours after writing it down?
Upon wrapping up topic 5.1, students completed a working with data question (page 184 #5).
Homework:
Part 1: Complete the DBQ on page 180. Work by yourself, this assignment will be collected on Monday/Tuesday in class.
Part 2: Read pages 185-187, take notes. Pay particular attention to the carbon cycle on page 186 (this is assessment statement 5.2.1)
Upon wrapping up topic 5.1, students completed a working with data question (page 184 #5).
Homework:
Part 1: Complete the DBQ on page 180. Work by yourself, this assignment will be collected on Monday/Tuesday in class.
Part 2: Read pages 185-187, take notes. Pay particular attention to the carbon cycle on page 186 (this is assessment statement 5.2.1)
Thursday, September 8, 2011
Food Webs
Today in class students had their first DBQ (Data Based Question) Pop Quiz (see answer below). After the quiz we looked at the TASIS Effort Scale to remind everyone that an effort 5 is truly outstanding where as an effort 3 is satisfactory work.
We spent the rest of the class learning about food chains, webs and trophic levels (Assessment Statements: 5.1.3 through 5.1.10).
Tonight for homework: Complete 5.1.8 in your notebook. To help you, go to the Ecology/Evolution (5, D, G) page and click on "Basic Build Your Own Food Web -Interactive"
Here are the answers from today's DBQ Pop Quiz (you can find the question on page 175 of the book).
1. The ecological concepts in Charles Darwin's description are food webs, biotic/abiotic interactions and decomposition.
2. The entangled bank is an ecosystem. An ecosystems is defined as a collection of all organisms that live in a particular place, which includes the nonliving or physical environment. When Darwin refers to the "birds singing on bushes [...] and with worms crawling through the damp earth." This is a perfect example of an ecosystem. Identifying his description as a habitat would be incorrect, because a habitat would only refer to the environment in which a species normally lives and not the other organisms in the area. Additionally, stating that Darwin's description is of a community, would be incorrect because a community is the assemblage of different species; it does not include the environment.
3a. The relationship between insects and other species is predation. The insects are food for the birds.
3b. The relationship between worms and other species is decomposition. The worms help to breakdown the other organisms.
We spent the rest of the class learning about food chains, webs and trophic levels (Assessment Statements: 5.1.3 through 5.1.10).
Tonight for homework: Complete 5.1.8 in your notebook. To help you, go to the Ecology/Evolution (5, D, G) page and click on "Basic Build Your Own Food Web -Interactive"

Here are the answers from today's DBQ Pop Quiz (you can find the question on page 175 of the book).
1. The ecological concepts in Charles Darwin's description are food webs, biotic/abiotic interactions and decomposition.
2. The entangled bank is an ecosystem. An ecosystems is defined as a collection of all organisms that live in a particular place, which includes the nonliving or physical environment. When Darwin refers to the "birds singing on bushes [...] and with worms crawling through the damp earth." This is a perfect example of an ecosystem. Identifying his description as a habitat would be incorrect, because a habitat would only refer to the environment in which a species normally lives and not the other organisms in the area. Additionally, stating that Darwin's description is of a community, would be incorrect because a community is the assemblage of different species; it does not include the environment.
3a. The relationship between insects and other species is predation. The insects are food for the birds.
3b. The relationship between worms and other species is decomposition. The worms help to breakdown the other organisms.
Monday, September 5, 2011
Starting Ecology & Getting to know the command terms
Today we started Topic 5: Ecology & Evolution. Each student received a copy of all of the syllabus points for topic 5 (see below and click to enlarge)
This will be a table of contents and a way for students to assess what they have learned. Today (or tomorrow for H period) we have covered 5.1.1, 5.1.9 and started 5.1.2.
Homework due next class: Click on "Statistics" in the blue bar. There you will also find a list of all of the command terms for IB Biology. Create a vocab sheet for all of the words in Objectives 1, 2 and 3. Love this piece of paper, you will be using it almost daily.

This will be a table of contents and a way for students to assess what they have learned. Today (or tomorrow for H period) we have covered 5.1.1, 5.1.9 and started 5.1.2.
Homework due next class: Click on "Statistics" in the blue bar. There you will also find a list of all of the command terms for IB Biology. Create a vocab sheet for all of the words in Objectives 1, 2 and 3. Love this piece of paper, you will be using it almost daily.
Subscribe to:
Posts (Atom)